Chapter 12: UCSF ChimeraX
Understanding the three-dimensional structures of biomolecules is essential for advancing our knowledge in diverse fields—from drug discovery to the computational modeling of complex biological processes. In this chapter, we introduce UCSF ChimeraX, a state-of-the-art visualization tool that transforms how researchers explore and analyze biomolecular structures.
1.1 Introduction
UCSF ChimeraX (commonly referred to as ChimeraX) is the next-generation molecular visualization program developed by the UCSF Resource for Biocomputing, Visualization, and Informatics (RBVI). It enables interactive visualization and analysis of molecular structures, density maps, molecular dynamics trajectories, and sequence alignments. ChimeraX is the successor to UCSF Chimera, which is no longer actively developed following the conclusion of its funding in 2016.
One of the key strengths of ChimeraX is its interoperability with a variety of computational tools, making it an invaluable resource for diverse applications. For example:
- MODELLER – Enables comparative protein structure modeling.
- AlphaFold – Provides deep-learning-based protein structure prediction.
- AutoDock (ViewDockX) – Facilitates molecular docking and ligand-binding analysis.
In this chapter, we will explore how to leverage ChimeraX’s advanced functionalities to gain insights into biomolecular structures and dynamics, and and prepare structures for molecular dynamics simulations, furthering our understanding of biological processes at the molecular level.
1.2 Overview of ChmieraX
Figure-1 shows the basic overview of ChimeraX, which is a highly customizable interface, allowing you to arrange and configure these elements to suit your preferences. The ChimeraX front window primarily consists of:
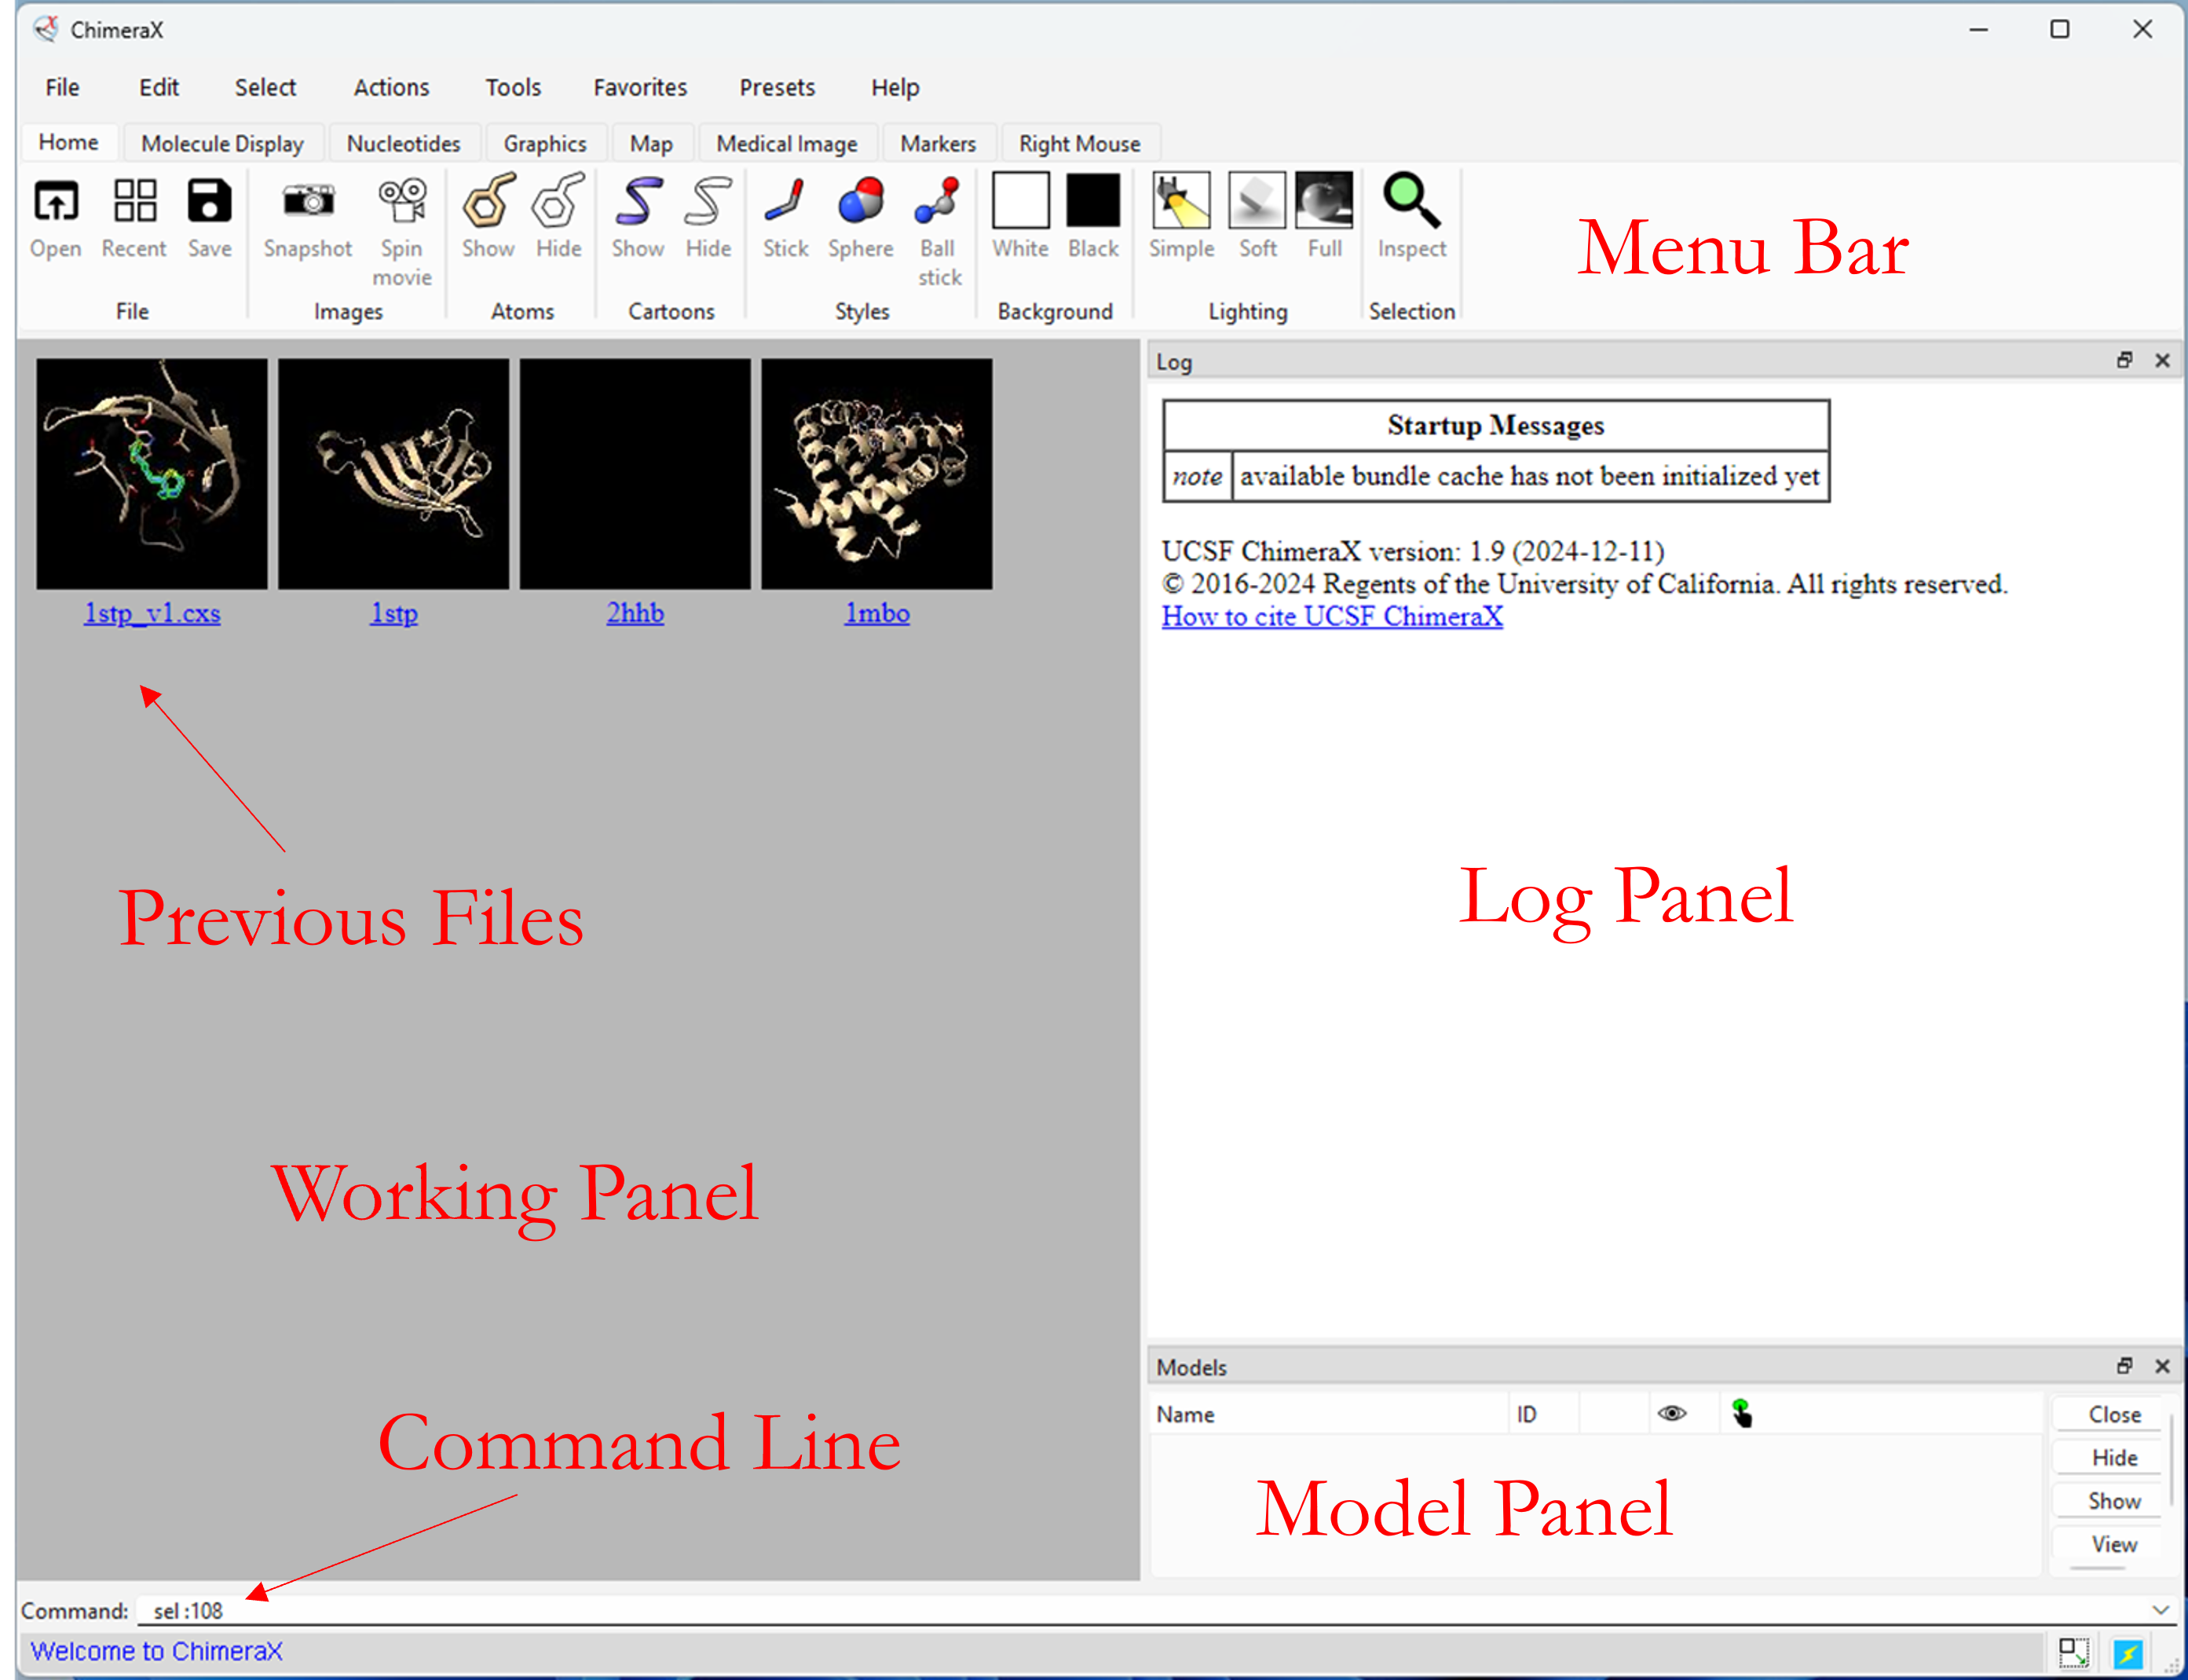
3D Graphics Window: This is the central area where you visualize and interact with 3D molecular structures.
- Toolbars: Located at the top, these provide quick access to common commands and tools.
- Panels: These are detachable windows that offer various functionalities:
- Model Panel: Displays a list of loaded models and allows for various operations on them.
- Command Line: Enables you to execute commands directly.
- Other panels: Depending on your needs, you might have panels for tools like sequence viewer, surface generation, volume visualization, and more. For example, clicking serquence botton will bring a new window panel below the Model Panel.
Panels can be easily shown, hidden, and repositioned. They can also be detached (undocked) from the main window and subsequently reinserted (docked). To manage panels:
- Dismiss a Panel: Click the “x” button on its title bar (if docked) or the generic close-window button (if undocked).
- Show a Hidden Panel: Check its name in the bottom section of the Tools menu or in the context menu of any docked panel’s title bar.
- Undock a Panel: Click the “rectangles” button on its title bar or drag/double-click its title bar.
- Redock a Panel: Drag or double-click its title bar to insert it back into the main window.
- Tab Panels: Drag a panel to the same area as another to create a tabbed set; clicking a tab brings the corresponding panel to the front.
For additional information ( ChimeraX Toolbar )
1.2.1 Basic Mouse Controls
In ChimeraX, the basic mouse controls for interacting with molecular structures and 3D visualizations are:
- Hover the mouse over atoms for a second, box will appear says: /A BTN 300 S1 (chain A, molecule code BTN, atom code #300, sulfur #1)
- Rotation, Translation, and Zooming
- Left Mouse Button (Click & Drag) → Rotate the structure
- Middle Mouse Button (Click & Drag) → Move (translate) the structure
- Right Mouse Button (Click & Drag) OR Scroll Wheel → Zoom in/out
- Selection and Picking
- Ctrl + Left Click → Select an atom, residue, or molecular component
- Ctrl + Shift + Left Click → Select multiple items
- Double Left Click on an Object → Center and zoom in on that object
- Alternative Mouse Modes (for Specific Tools)
- Alt + Left Click & Drag → Slab clipping (adjust depth of view)
- Shift + Right Click & Drag → Adjust threshold levels in volume data
- Ctrl + Mouse Scroll → Adjust contour levels for density maps
We can customize mouse actions via Tools → General → Mouse Modes, allowing you to assign different functions to each mouse button.
1.2.2 Basic Control
In this section, we will explore the basic controls for manipulating proteins in ChimeraX, using Human Deoxyhemoglobin (PDB: 2HHB) as our model structure. The structure consists of four chains (Alpha chains: Labeled A and C; Beta chains: Labeled B and D) and Ligands (Non-Protein Compounds): Heme group (HEM) and Phosphate ion.
Get comfortable with the mouse controls and buttons in ChimeraX, including those found under the “Home,” “Molecule Display,” and other menus. Practice essential operations such as rotation, translation, zooming, and selection (picking). For more details, refer to section 1.2.1, “Basic Mouse Control.”
Note: If the protein does not contain nucleotides, then nucleoside-related functions will not work in ChimeraX.
After experimenting with the display settings, you can restore the default view by selecting
Presets → Original Look
The following table provide instruction briefly for Selection of Chains and Atoms and Coloring of 2HHB.
| Step | Command/Instruction | Description |
|---|---|---|
| View Information | Hover over an atom | A pop-up box will display information, e.g., /A HEM 142 O1A (Chain A, Residue HEM & ID 300, Atom Oxygen & ID O1A). |
| Select Chain | Select → Chains → Chain A | to select chain A |
| Select Residue | Select → Residues → HEM | to select residues HEM in the molecule |
| Selection Mode | Select → Menu Mode → Replace Mode Select → Menu Mode → Add (+) Mode Select → Menu Mode → Intersect Mode | Removes any previous selection and replaces it with a new selection. Adds the new selection to the previously selected atoms. Selects only atoms that satisfy (logical AND operation) |
| Select Specific Residue | Select → Chains → Chain A Select → Menu Mode → Intersect Select → Residues → HEM or select atom from HEM → Ctrl + Up Arrow Key | To select HEM residue from Chain A |
| Reduce Selection | Ctrl + Down Arrow Key | to reduce the selection |
| Select Drag Mouse | Ctrl + Shift+ Left-Click+ Drag | Select a specific region |
| Atom Style | Actions → Atoms/Bonds → Atom Style → Ball & Stick | Set the atoms of HEM in ball & stick style |
| Coloring Selection | Action → Color → By Element | Coloring the selected HEM by element |
| Focus on a Selection | Actions → Focus command line view sel | Zoom into selected area |
| Invert selection | Select → Invert → Selected Models | Select everything except the current selection is highlighted. |
| Coloring | Action → Color → Orange | Coloring the everthing else expect HEM of chain A |
| Deselect Selection | Ctrl + Left-Click on blank space | to deselect the current selection. |
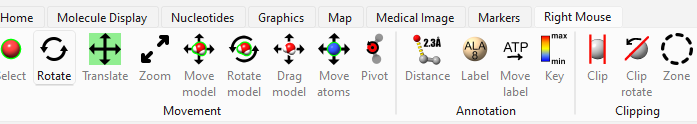
| Labeling | Action → Residue → Label → Name Actions → Color → All Options → Select only "Labels" Actions → Label → Set Label Height Menu → Rightmouse → ATP Move Label (Figure-2) | Label residue and adjust label font size and position |
| Measuring Distances | Ctrl + Shift Select HEM 142 O1D and PHE 46 CZ Tools → Structure Analysis → Distances and click "Create" | To measure the distance between them and label the distance |
1.2.3 Basic Command Line Controls
Working on command line in ChimeraX is very useful, Here are the basic commanda that may help us analysis the biomolecular structures.
- open 2HHB (To get structure from database, Note: older version Syntax is “fetch 2HHB” )
- color list (display full list of colors)
- color red (change the of select or if nothing is select then color everything)
- color sel green (Coloring the selected ligand to green)
- color sel byhet or color sel byhetero (Add standard heteroatoms coloring)
size sel atomRadius +0.5Increase selected atom radius- hide atoms
- sel :108 (Selecting that residue)
- sel clear (clear the selected items)
- show solvent (Showing all the water molecules in crystal)
- delete solvent (Removing all the water molecules, ChimeraX has “undo” button but deleting things may not work on recovering delete.)
Command Prompt Arguments Sign that represent:
- Model: #
- Chain: /
- Residues: :
Atoms: @
- close (close everything)
- close #ID (e.g. close #1.1 close specific submodel)
- open 6UDQ
- sel #1 (or select #1)
- sel #1/B (Select chain B in object 1)
- sel #2/C:10-30 (Select residue 10-30 of chain C in object 2)
- sel #2/A,C:10-20 (Select residue 10-30 of chain A and C in object 2)
- sel #3:lys@CA (Select all atoms CA of lysine in object 3)
- sel :108 (selecting residue 108)
- color sel silver (coloring the selected residue)
- hide bonds or ~hbonds (to hide hydrogen bonds)
- Creating and Removing Labels in ChimeraX (Command Line) ChimeraX allows flexible labeling of atoms, residues, chains, and models using the
labelcommand. Labels can display attributes, custom text, or structural information.
label del- Remove all labelslabel del atoms- Remove atom labelslabel del residues- Remove residue labelslabel del sel- Remove labels for selected objectslabel sel text "{0.name}{0.number}" height 1.5- Label selected residues with residue name and numberlabel @ca residues attr number- Labels each Cα atom with its residue number.label :1 residues attr chain_id height 4- Displays the chain identifier for residue 1 andheighcontrols lable size.label ligand residues attr name- label ligandslabel ligand text "{0.chain_id}:{0.name}{0.number}" height 2.5-Label ligands with full residue informationlabel /A:1 residues attr structure.name height 5 offset 1,1,1- Label residue 1 in chain A with structure (model) name and shifts label position in Ålabel /A:2-12 residues text "{0.phi:.1f},{0.psi:.1f}"- Label backbone dihedral angles (φ, ψ)
Squence view
sequence chain #1/A- to show the sequence of chain A
Hiding
- hide ligand
- hide ligand #1/A (hide onle ligands from a specific chain (e.g chain A))
- hide @/isHet (To hide all non-standard residues (ligands, modified residues, etc.))
- hide solvent (hide solvent molecules (like water))
1.3 Structure Analysis and Comparison
1.3.1 Hydrogen Bonds
Hydrogen bond analysis in ChimeraX typically involves preparing the structure, isolating the ligand and nearby residues, and displaying hydrogen bonds based on geometric criteria (distance and angle).
We will analyze hydrogen bonds around heme (HEM) ligands in human deoxyhemoglobin (PDB: 2HHB). The following structured workflow outlines the steps for hydrogen bond analysis. The Figure-3 dsplay the expected output.
| Step | Command / Instruction | Description |
|---|---|---|
| 1. Remove Solvent | del solvent | Removes water molecules to eliminate solvent hydrogen bonds. |
| 2. Removing chains | del #1/B, C, D | Deletes chains B, C, and D, leaving only chain A for analysis. |
| 3. Select Heme Group | sel :HEM or via menu: Select → Residue → Non-standard residues → HEM | Selects the heme (HEM) ligand for interaction analysis. |
| 4. Select Nearby Residues | sel zone :HEM 5 or via menu: Select > Zone → Set cutoff to 5 Å | Selects residues within 5 Å of the heme group to analyze interactions. |
| 5.Labeling | label sel & protein residues text "{0.name}{0.number}" height 1.5 label :HEM residues text "{0.name}{0.number}" height 2 label :HEM color yellow | Labeling amino acids and ligand in selected region |
| 6. Apply Coloring by Element | color byelement via menu: Actions > Color > By Element | Colors atoms based on their element type for better visualization. |
| 7. Hide Existing Hydrogen Bonds | ~hbonds | Clears previously displayed hydrogen bonds to avoid redundancy. |
| 8. Label Displayed Elements | label @@display | Displays atom labels to help identify key structural components. |
| 9. Select Ligand | sel :HEM | Selects the entire ligand |
| 10. Display Hydrogen Bonds | hbonds : HEM or hbonds ligand | Displays hydrogen bonds involving the ligand. |
| 11. Change Hydrogen Bond Color | color hbonds magenta | Changes hydrogen bond color to magenta for contrast. |
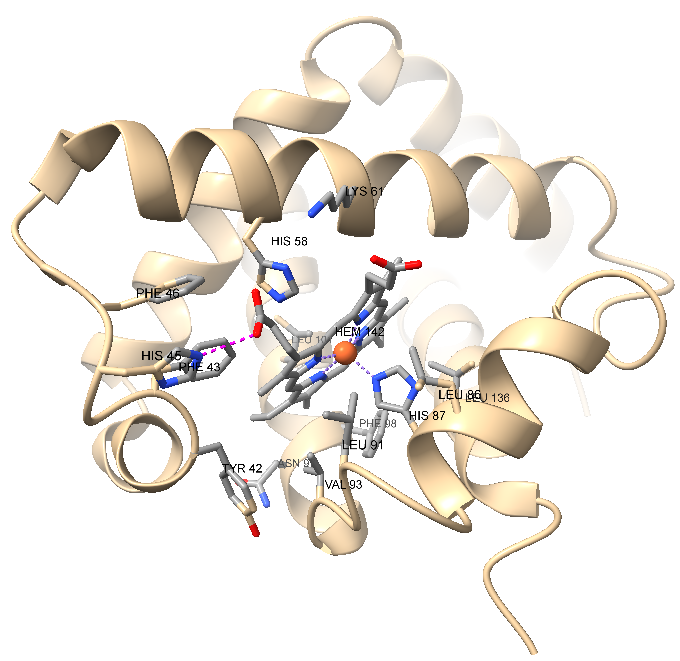
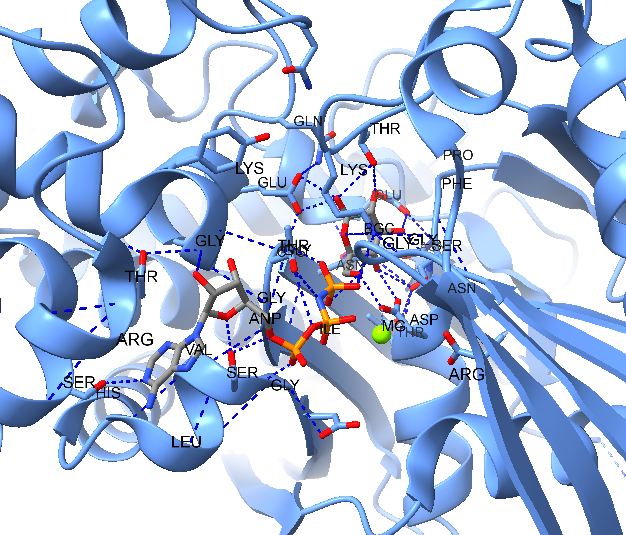
- Protein and Ligand Coloring: Color the entire protein in light blue and the ligand in gray.
- Heteroatom Coloring: Apply element-specific coloring (e.g., oxygen red, nitrogen blue) to all heteroatoms in the structure.
- Hydrogen Bond Analysis: Identify and highlight all hydrogen bonds within a 5Å radius of the ligand.
- Residue Labeling: Label the amino acid residues involved in hydrogen bond interactions with the ligand. Ensure that all visualizations are clear and properly formatted for effective analysis
Solution:
Steps to Visualize and Analyze Ligand Interactions in ChimeraX
- Get Structure :
open 3fgu - Coloring Protein & Ligand
-
color #1 cornflower blue -
color ligand gray
-
- Heteroatom Coloring:
color #1 byhetero - Hide Non-Ligand Atoms & Bonds
sel ligandsel ~sel(invert selection)Actions → Atoms/Bonds → Hide
- Display Magnesium Ion (Mg)
-
sel #1:Mg show #1:Mg
-
- Interaction Zone (5Å Around Ligand)
-
sel ligand - Expand selection to a 5Å interaction zone:
Select → Zone → 5 Å
-
- Hydrogen Bonds
-
del solvent - Hydrogen Bond Analysis:
Tools → Structure Analysis → Hydrogen Bonds - Hydrogen bond display:
Select "Limit by at least one end selected"
-
- Hide Cartoon Representation :
Actions → Hide → Cartoon - Label Residues in Interaction Region
- Select any atom in the interaction region:
Click on a residue involved in hydrogen bonding - Label residue name and number:
Actions → Label → Residue → Name
- Select any atom in the interaction region:
-
set bgColor white
1.3.2 Aligning Structure
In this section, we will explore how to compare multiple protein structures through structural alignment. Using ChimeraX’s MatchMaker tool, we will learn how to align two or more protein structures based on sequence and structural similarity. This process allows us to analyze conserved regions, structural differences, and evolutionary relationships. Additionally, we will examine sequence alignments to gain insights into functional similarities between proteins. By the end of this section, you will have a clear understanding of how to perform structural superimposition and sequence comparisons in ChimeraX.
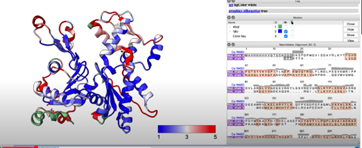
The following steps describe the alignment of the human deoxyhemoglobin (PDB ID: 2HHB) chain D with the oxymyoglobin (PDB ID: 1MBO) structure. The alignment will be colored based on the \(\alpha\) carbon RMSD values. The output using ChimeraX is shown Figure 6.
| Step | Command / Instruction | Description |
|---|---|---|
| 1. Get Structures | open 2hhb 1mbo | Getting structures from RCSB databank |
| 2. Structure Aligments | Structure Analysis → MatchMaker Alignment → Show pairwise sequence | Best-alignig pari of chaings and show pairwise sequence |
| 3. Hide Unwanted | cartoon hide #1/A,B,C hide #1/A,B,C hide #1\D hide #2 hide solvent | Hidding chains A, B, & B, non-standard residue from object 1 & 2, and solvent |
| 4. Show HEM | show #1/D:HEM #2:HEM | Showing HEM from #1 and #2 |
| 5. Color by \(\alpha\) C RMSDs | Tools > Structure Analysis > Render by Atricbute Attribute of to Residue Select Attribute seq-rmsdHistogram change blue to 0.25, white to 1.5 & red at 3 Color missing values with green select Corresponding Color Key | Color by \(\alpha\) C rmsd value & include Color Key |

- Blue represents regions with a C-alpha RMSD of ~1 Å or less, indicating high structural similarity.
- White represents regions with a C-alpha RMSD of ~3 Å or less, indicating intermediate structural similarity.
- Red represents regions with a C-alpha RMSD of ~5 Å or more, indicating significant structural deviations.
- Green represents region with no match.
open 4bql-
del #1/B,C,D(the structue 4bql has 4 chaines we delete chain B, C, and D ) - open 1j6z
-
matchmaker #2 to #1 show true: show true means show the sequence alignments. These proteins are quite different sequence. Here we can see Cα RMSD represent distance between Cα atoms when the bar are high means that Cα closer. We are going to use that color - using menu
Tools → Structure Analysis → Render by Atricbute. - From drop down select
attribute of to Residue - Select
attribute to seq-rmsd. On the histogram change range to blue at 1, white at 3 and red at 5 by selecting color bar and typing value . - Select
Color missing value with green (select green). (or command line rmsd #1 #2 color bfactor) - We can create color key clicking
correposing color key(we won’t change anything here)
1.4.2 Hydrogen Bond and Distance Analysis
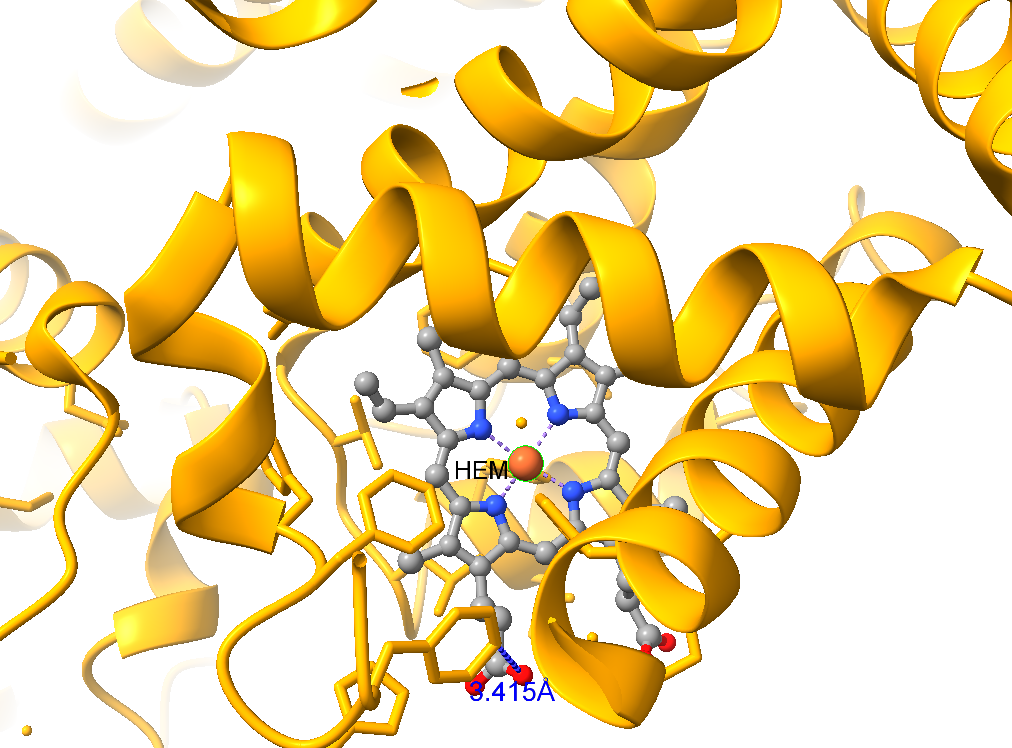
We will investigate the structure of the Staphylococcus aureus enzyme CrtM, a promising drug target due to its involvement in the biosynthesis of the virulence factor staphyloxanthin. Staphyloxanthin, responsible for the bacterium’s characteristic golden color, protects S. aureus from host immune attack. Our study will compare different structural conformations of CrtM.
open 3w7fdel #1/b(ordelete #1/b)view ligand– Focus the view on the ligand residueslabel ligand– Label residuelabel height 1.0– Change label height to 1.0 A, default 0.7A,del solvent– remove solvent to simplify analysis.label @@display-label the residues with sidechains, @@display refers to an attribute at the atom level called “display,” which indicates whether the atom is shown in the display area. In essence, the command is instructing to label all residues with atoms that are displayed.
In this model, farnesyl thiopyrophosphate (FPS) is shown with three magnesium ions (green spheres) that neutralize the phosphate charges. Coordination bonds between FPS, water, and the protein are depicted as dashed purple lines. Non-covalent interactions are represented as pseudobonds; hovering over these reveals the participating atoms and bond lengths.
Sel :21-select residue Serine (Ser, S) 21view selCtrl-click to pick oxygen of Ser 21Shift-Ctrl-doubleclick on the nearest phosphate oxygenTools → Structure Analysis → Distance(click create to show the distance between the selection)distance #1:21@OG #1:302@O1B: Prvious steps in command linesdistance :248@OH :302@O1B
Distance measurements are displayed as yellow dashed lines. These distances appear to match hydrogen bonds. Instead of manually measuring many distances and recalling specific hydrogen-bonding distances for different atom types, you can simply use the hbonds command or the H-Bonds tool.
sel :FPS– first select the FPS resides to limit H-bond search (or menu:Select → Residues →FPSview selhbonds sel restrict cross reveal true log true- Find H-bonds with one end selected.- Or
Tools→ Structure Analysis → H-Bonds select to Reveal atoms of H-bonding residues,Limit by selection: with exactly one end selected, and Log, other settings default.
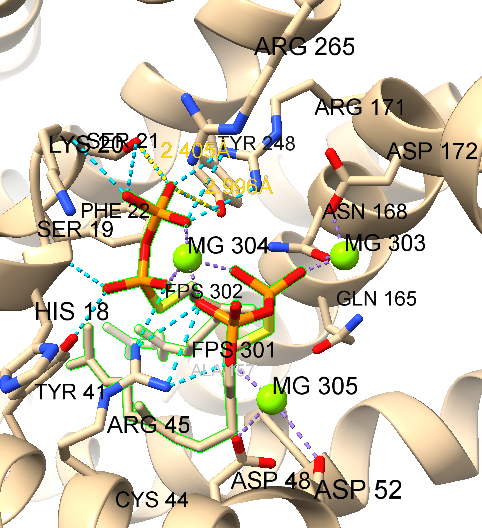
The hydrogen bonds are represented by light blue dashed lines. The two measured distances confirmed the presence of hydrogen bonding. More information can be found in the Log. if you would like to remove hydrogen bonds and distance then:
hide hbondsor~hbonds- Hide H-bonds~distance– Remove the distance measurements
1.4.3 Clashes and Contacts
- Clashes refer to unfavorable interactions occurring when atoms are too close together, often termed as close contacts.
- Contacts encompass various direct interactions, both polar and nonpolar, favorable and unfavorable, which include clashes.
open 3w7fdel #1/bsel #1:FPScolor sel graycolor sel byelementcontacts sel restrict cross reveal t log t select t– identifying contacts of selected residues (FPS)- Or
Tools → Structure Analysis → Contacts. Limit by selction with at least one end selected
The log provides a list of atom-atom contacts, ordered by decreasing van der Waals (vdW) overlap. The degree of overlap is indicated by a numerical value: positive values denote intersecting vdW spheres, zero indicates touching spheres, and negative values indicate separated spheres. A default setting includes slightly separated spheres as contacts. Interatomic distances are also reported.
~contacts– remove the contact pseudobonds~label- remove the labels
The Log provides detailed information about each atomic contact, but sometimes it’s more convenient to have a simpler list of interacting residues instead. To start, d.
info residues sel-list the selected residues in the log. You can see Serine (Ser, S) 21, Tyrosine (Tyr, Y) 248, and several others in the list.~sel- deselect the selection.
1.4.4 Angles, Rotamers,and Clashes
We will continue work on the 3w7f
sel clear– clear the selection.view :248- focus the view on Tyrosine (Tyr, Y) 248select: 248- select the whole residue Tyrosine (Tyr, Y) 248 orCtrl-click to select any atom in Tyr 248, then press the up arrow key on the keyboard to promote the selection to the whole residueTool show clashes– start clashes to setup class checking and rotat the sidechain interactively. OrTools → Structure Analysis → Clashesclashes sel restrict cross reveal t continuous t– restrict the option to limit by selection, revel atoms, frequency of checking to continuously Or it can be done using dialog box.Tools → Strctuure Analysis → Clashes: In the Clashes dialog, keep most options as defaults, except:- Turn on the option to
Limit by selection, set to:with exactly one end selectedTurn on the option atFrequency of checkingfor reveal atoms… Set the Frequency of checking to continuously(until dialog closed) (…and do not close the dialog yet, although it can be moved aside) As reported in the Log, no clashes with Tyr 248 are found in its initial position
- Turn on the option to
As reported in the Log, no clashes with Tyr 248 are found in its initial position Let’s measure the sidechain \(χ_1\) and \(χ_2\) angles of Tyr 248.
torsion :248@n, ca, cb, cg– measuring respect to α carbon, β carbon, and γ carbontorsion :248@ ca, cb, cg, cd1
The Log reports angles \(χ_1\) and \(χ_2\) as \(106.801^o\) and -\(142.054^o\), respectively.
The torsion command sets the angle defined by the four specified atoms to angle in degrees, or if angle is omitted, reports the current value in the Log. A centroid or marker can be specified as an atom. For changing the angle, the two middle atoms must be covalently bonded to one another.
set Right Mouse to "Bond Rotation"
With the assigned button, click on the Tyr 248 CA-CB bond (closest to the ribbon) and drag to change chi1 interactively, or on the CB-CG bond (the next one out, adjacent to the ring) to change chi2. Any clashes are shown as bright purple pseudobonds and updated automatically as the bond is rotated.
Close the Clashes dialog. If clash pseudobonds are still shown, remove them
~clashes– To hide the clashes displaytorsion :248@n,ca,cb,cg -106.801– restoring the angle backtorsion :248@ca,cb,cg,cd1 -142.054-restoring the angle back
Next, we will compare the conformation of Tyr 248 in the structure to tyrosine rotamers from a library. With Tyr 248 still selected (if not, Ctrl-click it), start the Rotamers tool:
1.4 Protein-Ligand Binding Sites
This tutorial explores some ways to examine the complementarity between proteins and their ligands. For this we will use a structure of the human Abl kinase domain in complex with the anticancer drug imatinib, 2hyy.
open 2hyyor open the using menu
After opening check the non-standard residues table, click the residue name STI (imatinib) to see where it is in the structure. Imatinib is a kinase inhibitor, and each copy of the kinase has its own imatinib binding site.
- All atoms as sticks can be shown with menu: Presets… Sticks or the command
preset sticks present original- to restore